With the recent drought that China has been experiencing, a growing concern is the fear of China’s “Great Lakes” drying up. The Poyang Lake is the largest freshwater body in China that has already shown signs of shrinking. It is a popular tourist attraction and an important ecological habitat for many species. As the largest freshwater lake in China, a persistent drought in China will only cause the Poyang Lake to shrink more. During the wet season and flood season, the Poyang Lake is replenished by the rivers that flow into it; however, if dry seasons become longer and the wet seasons are shorter, this will become problematic. Since the Poyang Lake drains into the Yangtze River (Xuchun et al. 2011), there is an expected relation between the lake and the Three Gorges Dam. The lost of a large freshwater lake is an important issue because it can cause tremendous damages to agriculture production which will inevitably hurt China’s economy as well as its people. If the Poyang Lake continues to shrink in the future, it will be impossible to reverse it and China may potentially see its largest freshwater source disappear.

Problem Statement:
Poyang Lake is under the pressure of the drought that China has been experiencing. With very limited rainfall, not much can be done to replenish it until the wet season. There have been claims of grasslands appearing where the Poyang Lake once covered and traces of fishes on the dried-up river beds. The farmers are also struggling since they have noticed the fish stock has been declining and rice fields have been affected. The most alarming problem is that many people do not have access to water due to the drought. Although there are other potential factors that have contributed to the shrinking of the Poyang Lake, the Three Gorges Dam (TGD) influence on the shrinking of the lake still remains a questionable. While taking the seasonal changes of the Poyang Lake into account, I will assess how the lake has changed before and after the completion of the Three Gorges Dam. With remote sensing, I will analyze a time series of the lake change in relation to the construction phases as well as the yearly discharges and flow of water downstream from the dam. If there are indicators that suggest the lake extent is dependent on the discharge patterns of the dam, then this can be useful for more in depth studies.

Study Area:
Poyang Lake is the largest fresh water lake in China and is situated in the northern part of Jiangxi province and is within the Yangtze River Basin. Based on recent reports the area of the lake today is only about 4,000 km2 with fluctuations due to seasonal variations. Within the Jiangxi Province there are five major rivers that flow into the Poyang Lake and the Yangtze River is where it drains. In the region, the fall and spring season is short and primarily has a wet and dry season. The dry season is during winter and the wet season with occasional floods is during summer (Andreoli R et al., 2007). Poyang Lake is a valued attraction in China because of its beautiful ocean like views and its rich species diversity, but most important, it serves as China’s most important agricultural region (Shankman and Liang, 2003).
 |
| Study area: Poyang Lake |

Methodology:
Times series of lake extent:
In order to determine if the Three Gorges Dam has any affects on the Poyang Lake, the appropriate data needs to be acquired. The Three Gorges Dam construction commenced in 1999 and was officially completed in the year 2009. In this study, the selected years for both seasons are as follow: 2000/2001, 2006, 2008, 2009, 2010, and 2011. With a wide range of satellite images available between those years, the most informative images would have to take into account the seasonal changes in the Jiangxi Province of China. The wet season for the region ranges from April to September and the dry season ranges from October to March (Andreoli R. et al., 2007). In this case, the selected month that I will be using for the analysis of the Poyang Lake is May (wet season) and January (dry season). The month of May was selected because it can be used as an indicator month to see if the wet season is starting early or late. January was selected as the month to use for analysis because January has remained the driest month and will reduce variation in results. Due to the lack of data available from LANDSAT and a need for a higher temporal resolution, TERRA MODIS 90A Products Level 1B will be used to conduct a change detection analysis. The bands that would be used include: Near Infrared, Red, and Green.
In order to detect water adequately, a Normalized Difference Water Index (NDWI) would be ideal with the band combination set as Near IR-Green-Near IR (3-2-3). The next step is to determine the NDWI value and set a threshold for water. Using the compute statistics function and creating a histogram (Figure 1), the spectral threshold for water is defined as -0.15 to -1.00.
Method I: Change Detection using Segmented Image
Based on the Airborne Underwater Geophysical (AUG) Signals’ multi-layer change detection algorithm, the process of segmenting the lake from the image was used. Using the segmentation of image function, the lake is extracted from the surrounding land based on the define threshold for water. This process is done for each image used for detecting change. The change detection function requires an initial state image and final state image. In this particular study, it will be beneficial and more detailed to conduct a comparison for the earliest and latest years as well as the years in between. Once conducted, the function will generate an image showing increases and decreases between the compared images. Set at a class threshold at 5, the segmented image would be classified into a distribution of +2 to -2 with 0 representing no change. An increase (+2) in the lake extent is represented as red and a decrease (-2) is represented as blue. Change values of +1 or -1 represents minor changes in the lake. To fully interpret the changes in detail, the change detection statistics function provides change in terms of differences in number of pixels. These values are utilized to generate a trend graph in excel.
Method II: Change Detection using Classification
An alternative algorithm that is utilized to analyze the change in lake extent is the use of classifications. This method is obtained from the Geography 169 Remote Sensing course at UCLA. The advantage of this method is a more simplified change result as well as the option to detect changes between three different time periods. For each NDWI image, the density slice function is applied to all the years. The water threshold at -0.15 to -1.00 is also used to extract the lake from the NDWI image. This algorithm requires time images being compared to be combined as one RGB image. For a change detection analysis of two different time periods, the band combination has the following setting:
R = Initial, G = Final, B = Initial
A comparison of three years will have the band combination:
R= Initial, G = Later, B = Final
Under this method, an increase is represented with the color green and a decrease is represented with the color Magenta. If there is no change within the time periods, the color is white. For this study, change detection was conducted for a comparison of two different time periods.
Method III: Analysis of Reclaimed Land
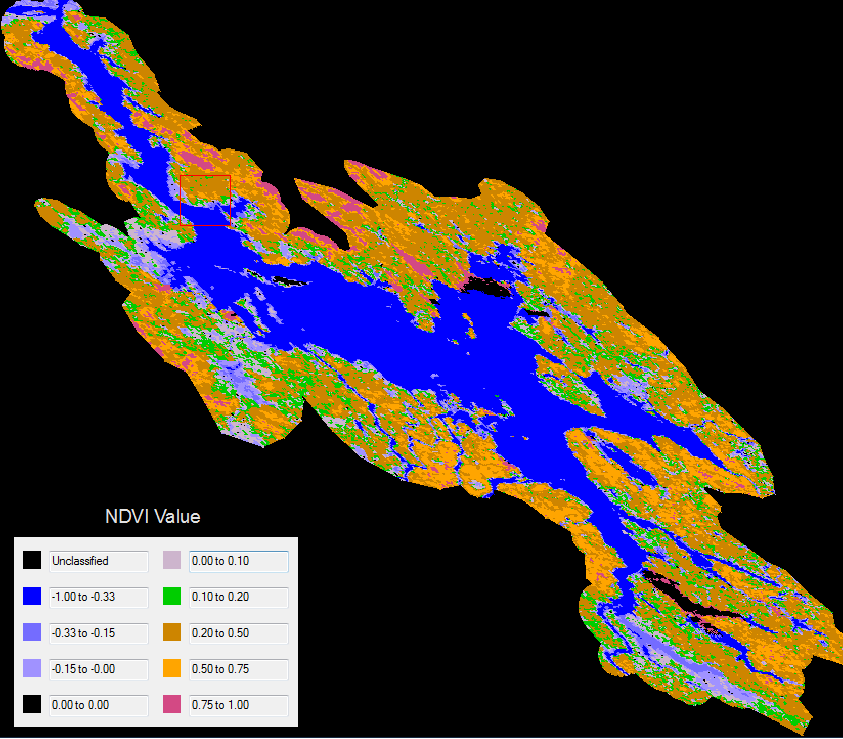
For visualizing purposes and as a supplement to change detection, the use of a Normalized Difference Vegetation Index (NDVI) can provide a better image of how much space the lake acquires. By using the band combination: Near IR-Red-Near IR (2-1-2) and transforming the produce RGB image as an NDVI, the results will provide data on the amount of greenness which represents vegetation. Applying a density slice to the NDVI image with the threshold of water still being set at -0.15 to -1.00 (Figure 2), the images for the given year can be compared to see how much land is reclaimed during the season.
Results:
Dry Season
During the month of January from 2001 to 2011, the extent of Poyang Lake has been decreasing. Based on the total number of pixels (Figure 4), there is a decline from 2001 to 2006. From 2006 to 2009, it remains stable with a slight drop in 2010. The year of 2011 shows an increase after 2010, but the lake cover is still below what it was in the year 2000. In the year 2010, the surface area of the lake was at its lowest point with 19527 pixels. The year of 2001 was when the lake’s surface area was at its highest. Between 2001 and 2006, there was a 35% decrease. There is an increase between 2006 and 2011 with an increase of 15%. The largest decrease occurred in the year 2009 to 2010 at 11% (difference of 2528 pixels) and the largest increase occurred in 2010 to 2011 at a 28% increase (difference of 5479 pixels).
Change Detection Method: Segmentation of Image


Red - Increase; Light Red and Light Blue - Minor Change to None; Blue - Decrease
Change Detection Method: Classification
Green - Increase; White - No change; Magenta - Decrease
Reclaimed Land: Density Slice of NDVI
Wet Season
In May, the change in the lake extent of Poyang Lake between the years 2000 and 2011 has showed extreme fluctuations after the year 2006 (Figure 4). The number of pixel trend remains relatively stable from 2000 until 2006. In the year of 2009, there is a drop in the number of pixel, but it rebounds in the year 2010. After 2011, there is another sharp decline. In 2010, the surface area of Poyang Lake was significantly large with 61938 pixels. The lease was in 2011 with total pixels of 27090. From 2000 to 2006, there was about a 7% increase in area. Between 2006 and 2011, there is a large difference at approximately 41%. The largest change in extent was a 56% decrease (34848 pixels) during 2010 to 2011 with the largest increase at 129% (35000) increase in 2009-2010.
Change Detection: Segmentation of Image
Red - Increase; Light Red and Light Blue - Minor Change to None; Blue - Decrease
Change Detection: Classification
Green - Increase; White - No change; Magenta - Decrease
Reclaimed Land: Density Slice of NDVI
Discussion:
One of the influencing factors of the extent of Poyang Lake is the flow of the Yangtze River. The reason for this is that if water levels are lower for the Yangtze River there will be an outflow from Poyang Lake and vice versa (Xuchun et al., 2011). With the completion of the Three Gorges Dam, we also know that the flow and water level of the Yangtze River is also dependent on the discharges from the dam.The results for the dry season show that the lake extent has been decreasing from the year 2001 to 2006 while the wet season remains constant from the year 2000 to 2006. This may suggests that the there has been an increasing outflow from the Poyang Lake during the dry season. Based on historical data of the Yangtze River and Poyang Lake interaction, prior to the year 2000, there was more of an outflow from the Yangtze River into the Poyang Lake. However, after the year 2000, the outflow of water has been declining and the Poyang Lake water level has started to decline as well (Xuchun et al., 2011). Assuming that there is a relation between water level and lake extent, the Three Gorges Dam may have played a role in this overturn when construction began in 1999. Looking at both dry and wet season figures, it is noticeable that there are interesting variations after 2006, which is the year that the dam was completed. During January of 2010, the lake extent appears to be smaller, but it increases in 2011. I was initially expecting a lower lake extent in 2011 since it is a dry season and during the drought period, but it is possible that the lake continues to shrink after January. The most interesting variation is during the wet season between the year 2009 and 2011. This is significant because it is an immediate fluctuation between a drought and flooding period. In general May is a month during the wet season; however, for two droughts to occur during the months of May is a serious issue. At the same time, the lake has shrunk more in 2011 since 2009. If another drought hits during the month of May, it will become more evident that this is not a natural phenomenon and is in fact a result of human activities. It is possible that during the months that the Three Gorges Dam reduces their discharges to increase the reservoir, it may be adding more pressure to Poyang Lake and causing it to shrink even more during a severe drought.
Conclusion:
There is evidence to suggest that the Three Gorges Dam does play a role in the shrinking of Poyang Lake because there is a relationship between the Yangtze River. The limitation is that there is not enough evidence to prove that it is the primary cause. Based on the results and past data, a major factor that contributes to the shrinking of the lake involves climate. In cases where the seasons can be unpredictable and fluctuates, it is difficult to determine what causes the seasons to shift drastically. The results that were produced provided useful information on the change over time. Solely utilizing the extent of the Poyang Lake lacks accuracy because water level is a key component. At the same time, the classification of water using the NDWI may have minor inaccuracy because there are cases where shallow water and barren land becomes difficult to distinguish. The study of lake extent of Poyang Lake can be expanded upon if more detailed data on the discharges from the Three Gorges Dam was taken into account as well as an analysis of years that were not included.
Tables and Figures:
Dry Season:
Wet Season:
Work Cited:
Andreoli R., Yésou Y., J Li, Desnos Y-L., Shifeng H. & De Fraipont P. (2007): Poyang Hu (Jiangxi
Province, P. R. of China) Area Variations between January 2004 and June 2006 Using ENVISAT Low and Medium Resolution Time Series, Annals of GIS, 13:1-2, 24-35
Chen X., Zong Y., Zhang E., Xu J., Li. (2001): Human impacts on the Changjiang(Yangtze) River basin, China, with special reference to the impacts on the dry season water discharges into the sea, Elsevier, 111-123
Global Nature Fund (2011): Serious flooding after serious drought in the Poyang lake watershed, 1-2
Shankman D., Liang Q. (2003): Landscape Changes and Increasing Flood Frequency in China’s Poyang Lake Region, 5:4, 434-445
Ye X., Zhang Q., Bai L. (2011): Long-term Trend Analysis of Effect of the Yangtze River on Water Level Variation of Poyang Lake (1960 to 2007), 543-545
Sources of Images:
http://www.telegraph.co.uk/news/worldnews/asia/china/8546673/Chinas-largest-inland-lake-dries-up-as-country-battles-drought.html
http://english.peopledaily.com.cn/90783/91300/7599596.html
http://china.org.cn/english/China/237208.htm
In order to determine if the Three Gorges Dam has any affects on the Poyang Lake, the appropriate data needs to be acquired. The Three Gorges Dam construction commenced in 1999 and was officially completed in the year 2009. In this study, the selected years for both seasons are as follow: 2000/2001, 2006, 2008, 2009, 2010, and 2011. With a wide range of satellite images available between those years, the most informative images would have to take into account the seasonal changes in the Jiangxi Province of China. The wet season for the region ranges from April to September and the dry season ranges from October to March (Andreoli R. et al., 2007). In this case, the selected month that I will be using for the analysis of the Poyang Lake is May (wet season) and January (dry season). The month of May was selected because it can be used as an indicator month to see if the wet season is starting early or late. January was selected as the month to use for analysis because January has remained the driest month and will reduce variation in results. Due to the lack of data available from LANDSAT and a need for a higher temporal resolution, TERRA MODIS 90A Products Level 1B will be used to conduct a change detection analysis. The bands that would be used include: Near Infrared, Red, and Green.
In order to detect water adequately, a Normalized Difference Water Index (NDWI) would be ideal with the band combination set as Near IR-Green-Near IR (3-2-3). The next step is to determine the NDWI value and set a threshold for water. Using the compute statistics function and creating a histogram (Figure 1), the spectral threshold for water is defined as -0.15 to -1.00.
 |
| Figure 1: NDWI |
Method I: Change Detection using Segmented Image
Based on the Airborne Underwater Geophysical (AUG) Signals’ multi-layer change detection algorithm, the process of segmenting the lake from the image was used. Using the segmentation of image function, the lake is extracted from the surrounding land based on the define threshold for water. This process is done for each image used for detecting change. The change detection function requires an initial state image and final state image. In this particular study, it will be beneficial and more detailed to conduct a comparison for the earliest and latest years as well as the years in between. Once conducted, the function will generate an image showing increases and decreases between the compared images. Set at a class threshold at 5, the segmented image would be classified into a distribution of +2 to -2 with 0 representing no change. An increase (+2) in the lake extent is represented as red and a decrease (-2) is represented as blue. Change values of +1 or -1 represents minor changes in the lake. To fully interpret the changes in detail, the change detection statistics function provides change in terms of differences in number of pixels. These values are utilized to generate a trend graph in excel.
Method II: Change Detection using Classification
An alternative algorithm that is utilized to analyze the change in lake extent is the use of classifications. This method is obtained from the Geography 169 Remote Sensing course at UCLA. The advantage of this method is a more simplified change result as well as the option to detect changes between three different time periods. For each NDWI image, the density slice function is applied to all the years. The water threshold at -0.15 to -1.00 is also used to extract the lake from the NDWI image. This algorithm requires time images being compared to be combined as one RGB image. For a change detection analysis of two different time periods, the band combination has the following setting:
A comparison of three years will have the band combination:
Under this method, an increase is represented with the color green and a decrease is represented with the color Magenta. If there is no change within the time periods, the color is white. For this study, change detection was conducted for a comparison of two different time periods.
Method III: Analysis of Reclaimed Land
For visualizing purposes and as a supplement to change detection, the use of a Normalized Difference Vegetation Index (NDVI) can provide a better image of how much space the lake acquires. By using the band combination: Near IR-Red-Near IR (2-1-2) and transforming the produce RGB image as an NDVI, the results will provide data on the amount of greenness which represents vegetation. Applying a density slice to the NDVI image with the threshold of water still being set at -0.15 to -1.00 (Figure 2), the images for the given year can be compared to see how much land is reclaimed during the season.
 |
| Figure 2: NDVI |
Results:
Dry Season
During the month of January from 2001 to 2011, the extent of Poyang Lake has been decreasing. Based on the total number of pixels (Figure 4), there is a decline from 2001 to 2006. From 2006 to 2009, it remains stable with a slight drop in 2010. The year of 2011 shows an increase after 2010, but the lake cover is still below what it was in the year 2000. In the year 2010, the surface area of the lake was at its lowest point with 19527 pixels. The year of 2001 was when the lake’s surface area was at its highest. Between 2001 and 2006, there was a 35% decrease. There is an increase between 2006 and 2011 with an increase of 15%. The largest decrease occurred in the year 2009 to 2010 at 11% (difference of 2528 pixels) and the largest increase occurred in 2010 to 2011 at a 28% increase (difference of 5479 pixels).
 |
| Figure 3: Lake Change (Dry Season) |
Change Detection Method: Segmentation of Image
Change Detection Method: Classification
Reclaimed Land: Density Slice of NDVI
 |
| Dry Season: NDVI 2001 |
 |
| Dry Season: NDVI 2006 |
 |
| Dry Season: NDVI 2008 |
 |
| Dry Season: NDVI 2009 |
 |
| Dry Season: NDVI 2010 |
 |
| Dry Season: NDVI 2011 |
Wet Season
In May, the change in the lake extent of Poyang Lake between the years 2000 and 2011 has showed extreme fluctuations after the year 2006 (Figure 4). The number of pixel trend remains relatively stable from 2000 until 2006. In the year of 2009, there is a drop in the number of pixel, but it rebounds in the year 2010. After 2011, there is another sharp decline. In 2010, the surface area of Poyang Lake was significantly large with 61938 pixels. The lease was in 2011 with total pixels of 27090. From 2000 to 2006, there was about a 7% increase in area. Between 2006 and 2011, there is a large difference at approximately 41%. The largest change in extent was a 56% decrease (34848 pixels) during 2010 to 2011 with the largest increase at 129% (35000) increase in 2009-2010.
 |
| Figure 4: Lake Change (Wet Season) |
Change Detection: Segmentation of Image
Change Detection: Classification
Reclaimed Land: Density Slice of NDVI
 |
| Wet Season: NDVI 2000 |
 |
| Wet Season: NDVI 2006 |
 |
| Wet Season: NDVI 2008 |
 |
| Wet Season: NDVI 2009 |
 |
| Wet Season: NDVI 2010 |
 |
| Wet Season: NDVI 2011 |
Discussion:
One of the influencing factors of the extent of Poyang Lake is the flow of the Yangtze River. The reason for this is that if water levels are lower for the Yangtze River there will be an outflow from Poyang Lake and vice versa (Xuchun et al., 2011). With the completion of the Three Gorges Dam, we also know that the flow and water level of the Yangtze River is also dependent on the discharges from the dam.The results for the dry season show that the lake extent has been decreasing from the year 2001 to 2006 while the wet season remains constant from the year 2000 to 2006. This may suggests that the there has been an increasing outflow from the Poyang Lake during the dry season. Based on historical data of the Yangtze River and Poyang Lake interaction, prior to the year 2000, there was more of an outflow from the Yangtze River into the Poyang Lake. However, after the year 2000, the outflow of water has been declining and the Poyang Lake water level has started to decline as well (Xuchun et al., 2011). Assuming that there is a relation between water level and lake extent, the Three Gorges Dam may have played a role in this overturn when construction began in 1999. Looking at both dry and wet season figures, it is noticeable that there are interesting variations after 2006, which is the year that the dam was completed. During January of 2010, the lake extent appears to be smaller, but it increases in 2011. I was initially expecting a lower lake extent in 2011 since it is a dry season and during the drought period, but it is possible that the lake continues to shrink after January. The most interesting variation is during the wet season between the year 2009 and 2011. This is significant because it is an immediate fluctuation between a drought and flooding period. In general May is a month during the wet season; however, for two droughts to occur during the months of May is a serious issue. At the same time, the lake has shrunk more in 2011 since 2009. If another drought hits during the month of May, it will become more evident that this is not a natural phenomenon and is in fact a result of human activities. It is possible that during the months that the Three Gorges Dam reduces their discharges to increase the reservoir, it may be adding more pressure to Poyang Lake and causing it to shrink even more during a severe drought.
Conclusion:
There is evidence to suggest that the Three Gorges Dam does play a role in the shrinking of Poyang Lake because there is a relationship between the Yangtze River. The limitation is that there is not enough evidence to prove that it is the primary cause. Based on the results and past data, a major factor that contributes to the shrinking of the lake involves climate. In cases where the seasons can be unpredictable and fluctuates, it is difficult to determine what causes the seasons to shift drastically. The results that were produced provided useful information on the change over time. Solely utilizing the extent of the Poyang Lake lacks accuracy because water level is a key component. At the same time, the classification of water using the NDWI may have minor inaccuracy because there are cases where shallow water and barren land becomes difficult to distinguish. The study of lake extent of Poyang Lake can be expanded upon if more detailed data on the discharges from the Three Gorges Dam was taken into account as well as an analysis of years that were not included.
Tables and Figures:
Dry Season:
| Change Detection Statistics: 2001 - 2006 |
| Change Detection Statistics: 2001 - 2011 |
| Change Detection Statistics: 2006 - 2011 |
| Change Detection Statistics: 2008 - 2009 |
| Change Detection Statistics: 2009 - 2010 |
| Change Detection Statistics: 2010 - 2011 |
Wet Season:
| Change Detection Statistics: 2000 - 2006 |
| Change Detection Statistics: 2000 - 2011 |
| Change Detection Statistics: 2006 - 2011 |
| Change Detection Statistics: 2008 - 2009 |
| Change Detection Statistics: 2009 - 2010 |
| Change Detection Statistics: 2010 - 2011 |
Work Cited:
Andreoli R., Yésou Y., J Li, Desnos Y-L., Shifeng H. & De Fraipont P. (2007): Poyang Hu (Jiangxi
Province, P. R. of China) Area Variations between January 2004 and June 2006 Using ENVISAT Low and Medium Resolution Time Series, Annals of GIS, 13:1-2, 24-35
Chen X., Zong Y., Zhang E., Xu J., Li. (2001): Human impacts on the Changjiang(Yangtze) River basin, China, with special reference to the impacts on the dry season water discharges into the sea, Elsevier, 111-123
Global Nature Fund (2011): Serious flooding after serious drought in the Poyang lake watershed, 1-2
Shankman D., Liang Q. (2003): Landscape Changes and Increasing Flood Frequency in China’s Poyang Lake Region, 5:4, 434-445
Ye X., Zhang Q., Bai L. (2011): Long-term Trend Analysis of Effect of the Yangtze River on Water Level Variation of Poyang Lake (1960 to 2007), 543-545
Sources of Images:
http://www.telegraph.co.uk/news/worldnews/asia/china/8546673/Chinas-largest-inland-lake-dries-up-as-country-battles-drought.html
http://english.peopledaily.com.cn/90783/91300/7599596.html
http://china.org.cn/english/China/237208.htm
Author: Gary Te
Major: Geography Environmental Studies
Course: Geography 169